Individual event visualization
Individual event visualization#
Here we show an example on how to plot the individual events of a given run. We have two options for doing this:
Running
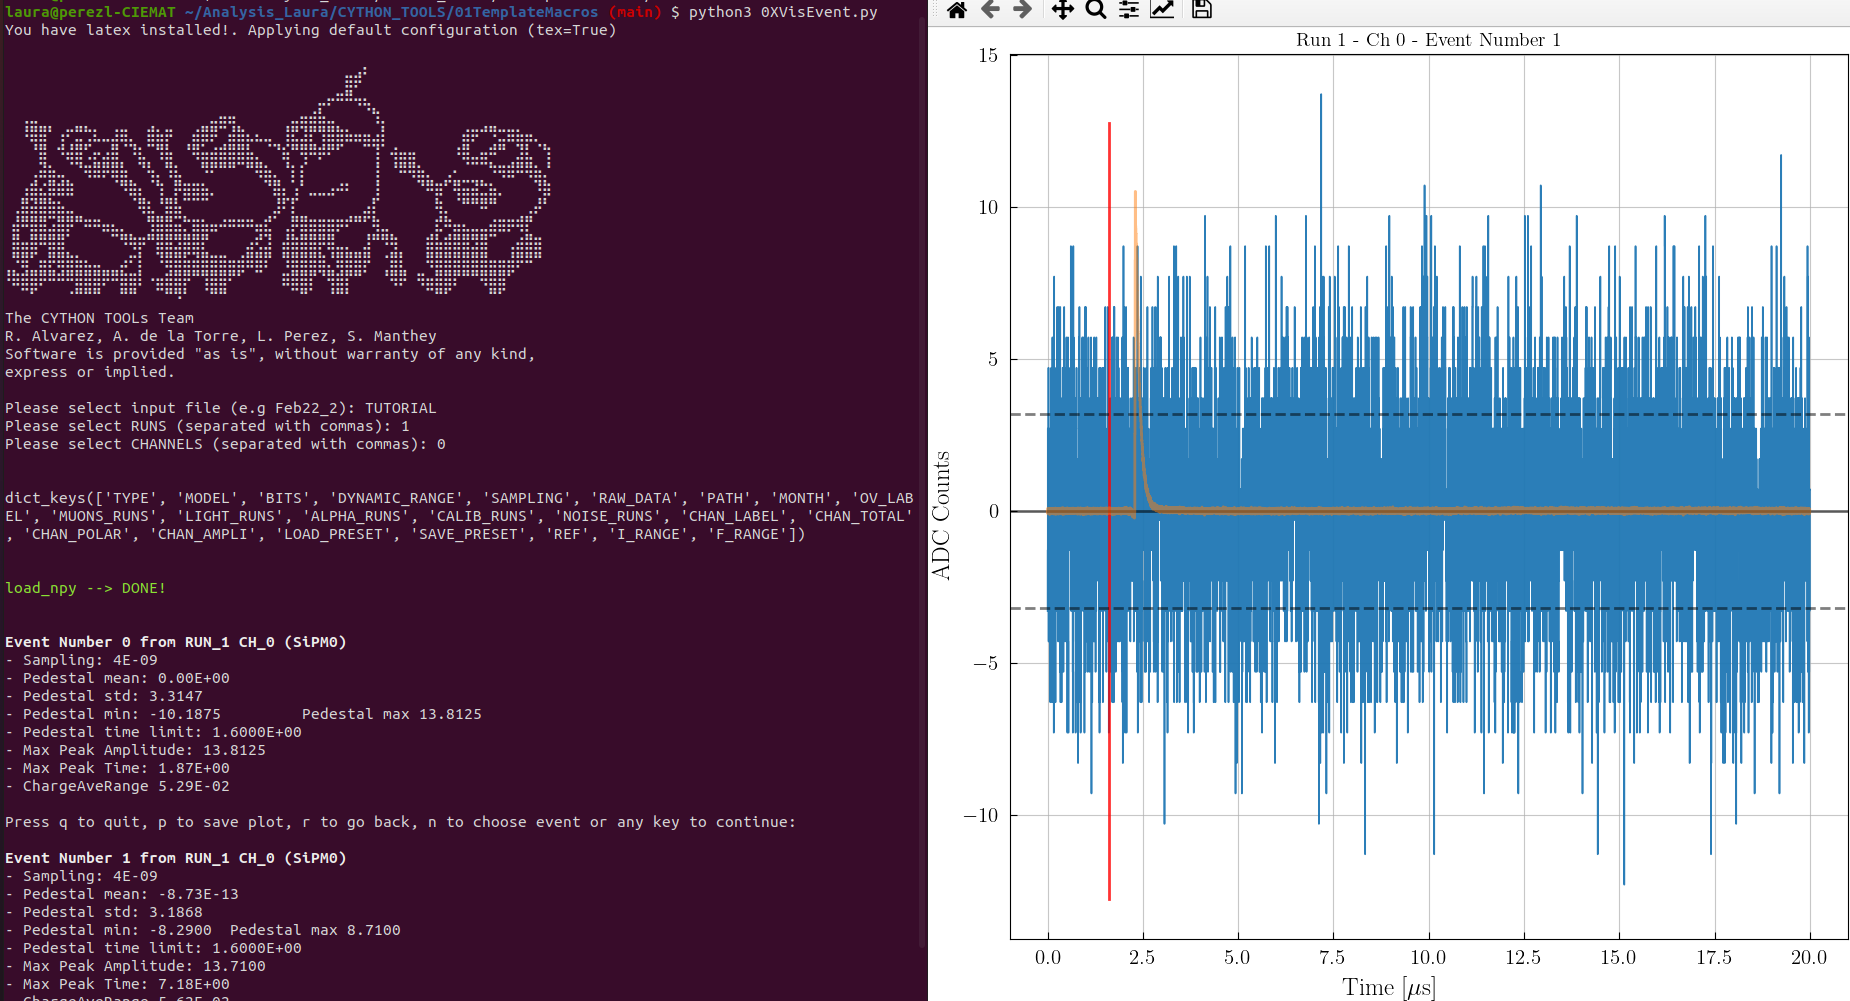
0XVisEvents.pymacro with the following configuration:
python3 0XVisEvent.py -r 1 -c 0
[?] select input file  [flag: -i]: TUTORIAL
[?] select load_preset [flag: -l]: ANA    (or RAW)
[?] select key         [flag: -k]: AnaADC (or RawADC)
The vis.npy function will plot the individual events for the AnaADC key (i.e. processed waveforms).
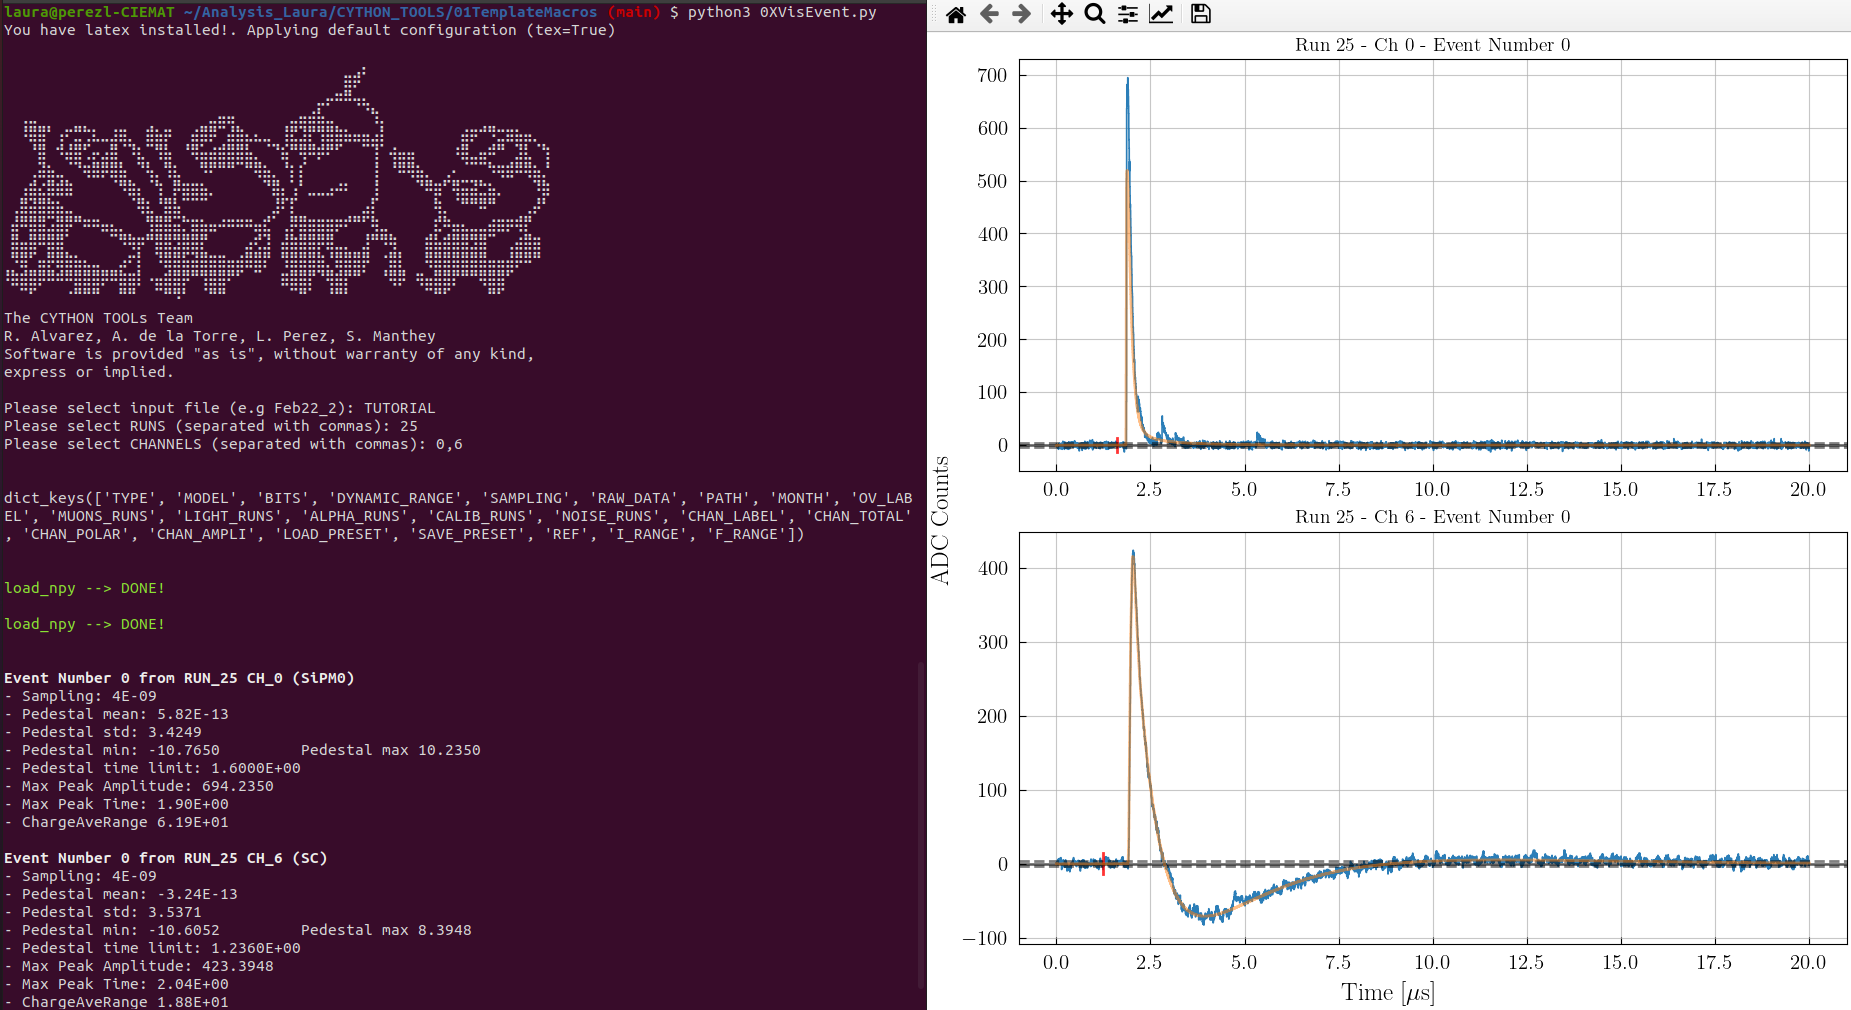
We can also introduce more than 1 channel in which case we will see them simultaneously.
python3 0XVisEvent.py -r 1 -c 0,6
[?] select input file  [flag: -i]: TUTORIAL
[?] select load_preset [flag: -l]: ANA    (or RAW)
[?] select key         [flag: -k]: AnaADC (or RawADC)
The second option is using the
0XVisEvents.ipynbnotebook. Here you can see an static option (analogous to the output obtained with the macro) and an interactive option displayed below.
(Source code, html)